南湖新闻网讯(通讯员 刘婷婷)近日, 我校资源与环境学院孟冉老师团队在森林扰动智能监测预测研究方向上连续发表两篇研究论文。该论文发表于国际遥感学术期刊Remote Sensing of Environment。
森林是陆地生态系统的主体,为人类提供了水土保持、调节气候、碳汇等重要的生态系统服务功能。砍伐和病虫害等扰动(disturbance)是森林生态系统退化的主要驱动因子,而气候变化又正在全球范围内显著加剧森林扰动的发生(图1)。因此,全面、及时、准确地森林扰动遥感智能监测预测,对建立气候智能型的自然资源管理措施体系,以应对全球气候变化的挑战至关重要。

图1. 2000-2015全球森林扰动分布图;图引用自Curtis et al, Classifying drivers of global forest loss, Science, Volume: 361, Issue: 6407, Pages: 1108-1111, DOI: (10.1126/science.aau3445)
砍伐会剧烈改变生态系统的组成和结构,进而影响水循环和碳循环。与单年或多年数据生成的砍伐图相比,月度的森林砍伐制图可为研究社会经济驱动因素的砍伐方式(例如,区别抢救性伐木、刀耕火种与其他伐木行为)以及描述相关的年内碳和水文动态变化提供更多的时间细节信息。然而,频繁的云雨天气限制了光学遥感在绘制森林扰动方面应用的及时性,合成孔径雷达可以穿透云雨,不受天气状态影响,为实现更及时的森林砍伐动态监测提供了机会。
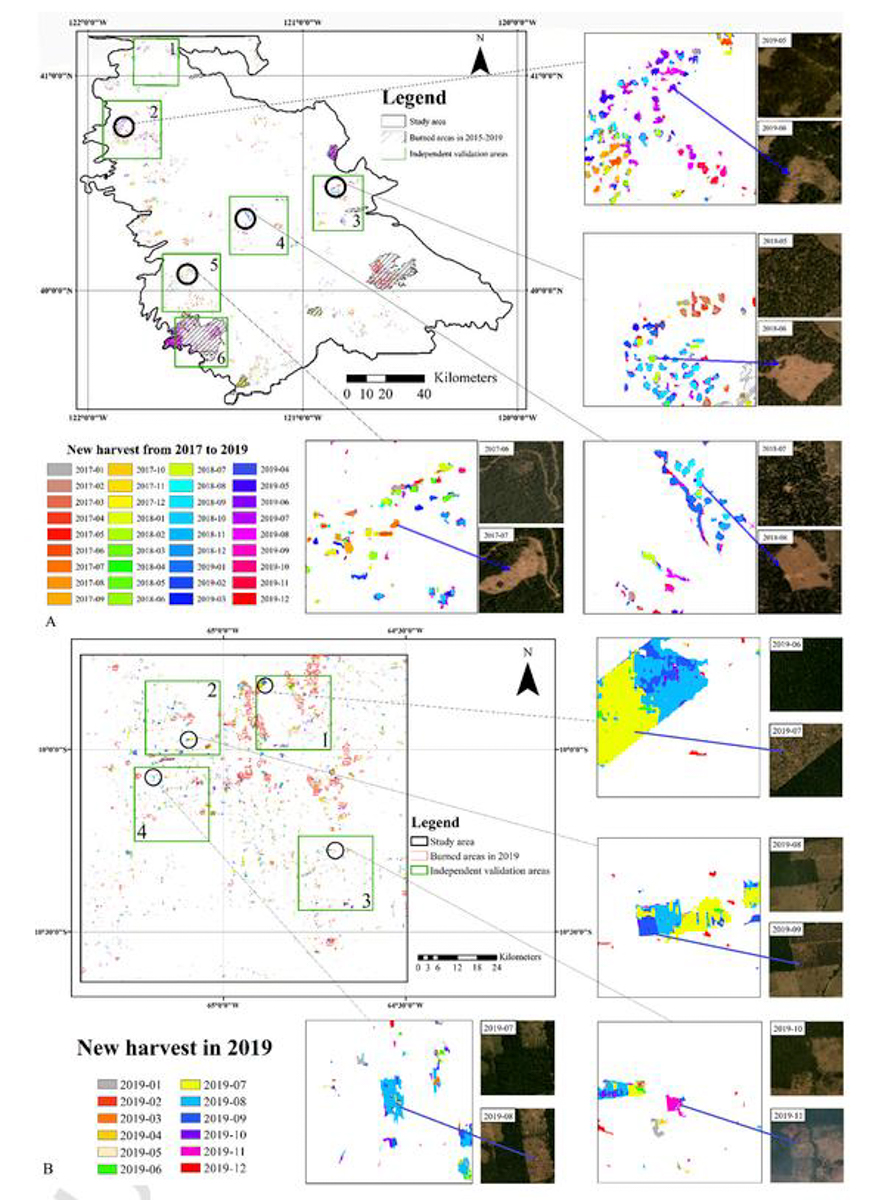
针对这一问题,孟冉老师团队提出了利用合成孔径雷达,云计算平台和深度学习进行森林砍伐月度制图的新方法。该方法在全球两个有着不同社会经济驱动因素的森林砍伐热点地区(美国加州和巴西亚马逊热带雨林,图2)进行了长时序、大面积测试和验证。验证结果表明了该方法克服了传统光学遥感在多云雨地区的应用限制,建立的模型具有高度的准确性和时空迁移性,可在前所未有的时空颗粒度上,量化分析亚马逊雨林等热点地区砍伐的时空过程,研究农业扩张和干旱等因素对毁林的影响。研究成果以“Monthly mapping of forest harvesting using dense time series Sentinel-1 SAR imagery and deep learning”为题发表,孟冉老师为论文通讯作者,博士生孙瑞为论文共同第一作者。

图2. 美国加州地区(A)和巴西朗多尼亚地区(B)的月度森林砍伐结果图。每个研究区有单独的放大视图。在四个放大视图的右侧是砍伐前一月和后一月的高空间分辨率影像,影像由Planet CubeSat提供。
受气候变化带来的影响,森林的生境也正发生悄然的变化,为森林有害生物的扩散入侵和病虫害的大面积爆发创造了有利条件。而如何全面、及时、准确地监测病虫害爆发的时空格局,并在此基础上预测其爆发状况,对制订有效的风险缓解和管理策略,遏制病害传播蔓延至关重要。而与具有群丛替代(Stand-replacing)特征的扰动(如砍伐和火灾)相比,森林病虫害引起的卫星遥感光谱信号变化微弱,特别是在病虫害爆发早期或低烈度区域极易与森林季节性变化信号混淆,造成错分、漏分。因此,传统卫星遥感监测方法的监测精度较低,且具有较强的滞后性,无法满足森林有害生物管理中对病虫害爆发智能监测预警的要求。
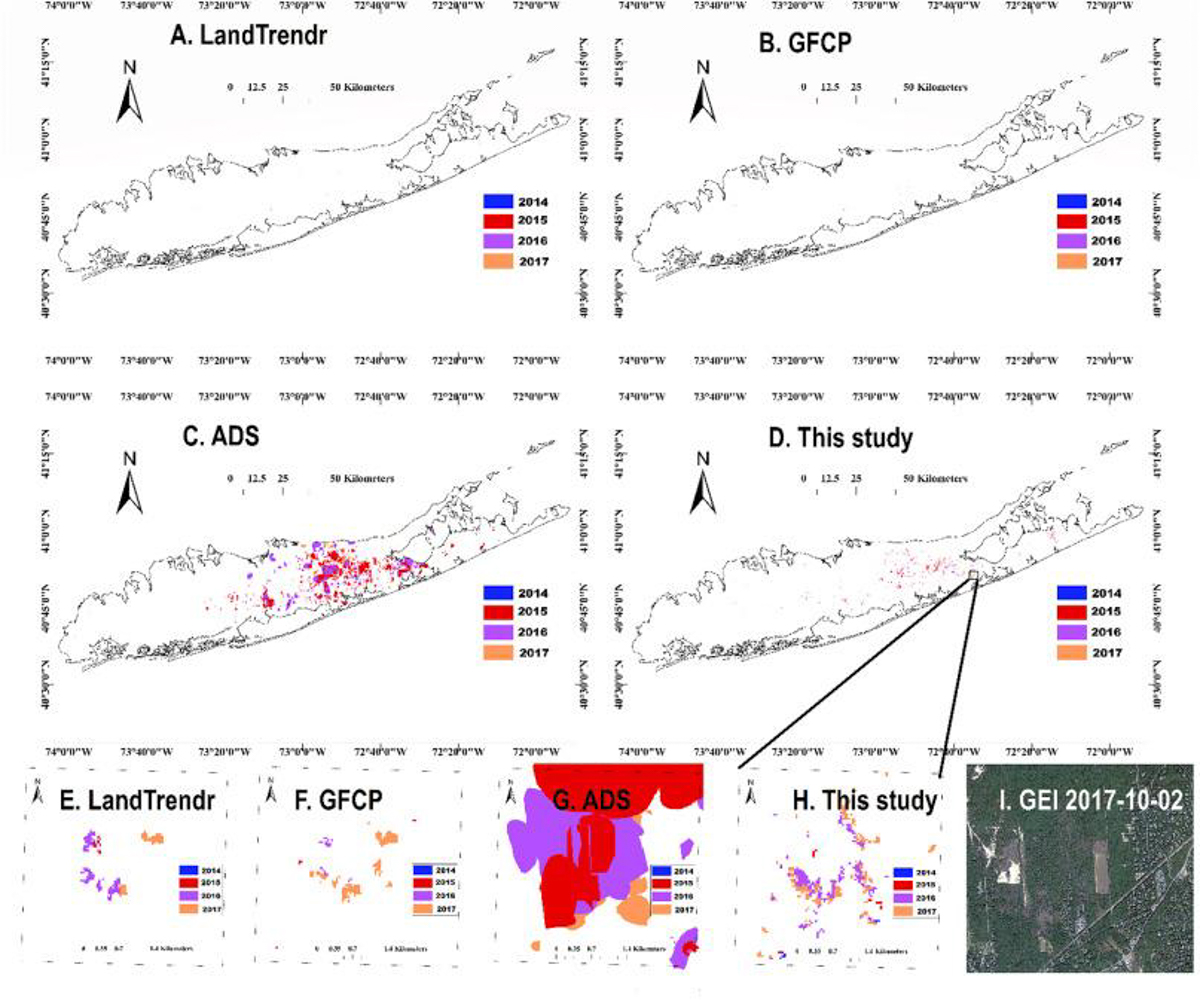
针对这一挑战,孟冉老师团队基于长时序卫星遥感数据和云计算平台,以一种蛀干型害虫在温带混交林的入侵及扩散传播为例,提出了病虫害智能监测预测的新方法。该方法首先针对病虫害“局地脉动爆发”(localized pulses)的特点,提出并定义了相关时空背景特征,显著增强了传统方法的探测精度(图3)。在此基础上,研究团队又提出了高精度的虫害烈度监测模型,对研究区内该虫害爆发的时空烈度进行了动态追踪。

图3. 本研究提出的新方法和传统方法监测效果对比图。从图中与传统方法相比,可以看出本方法具有更高的空间颗粒度和探测精度。
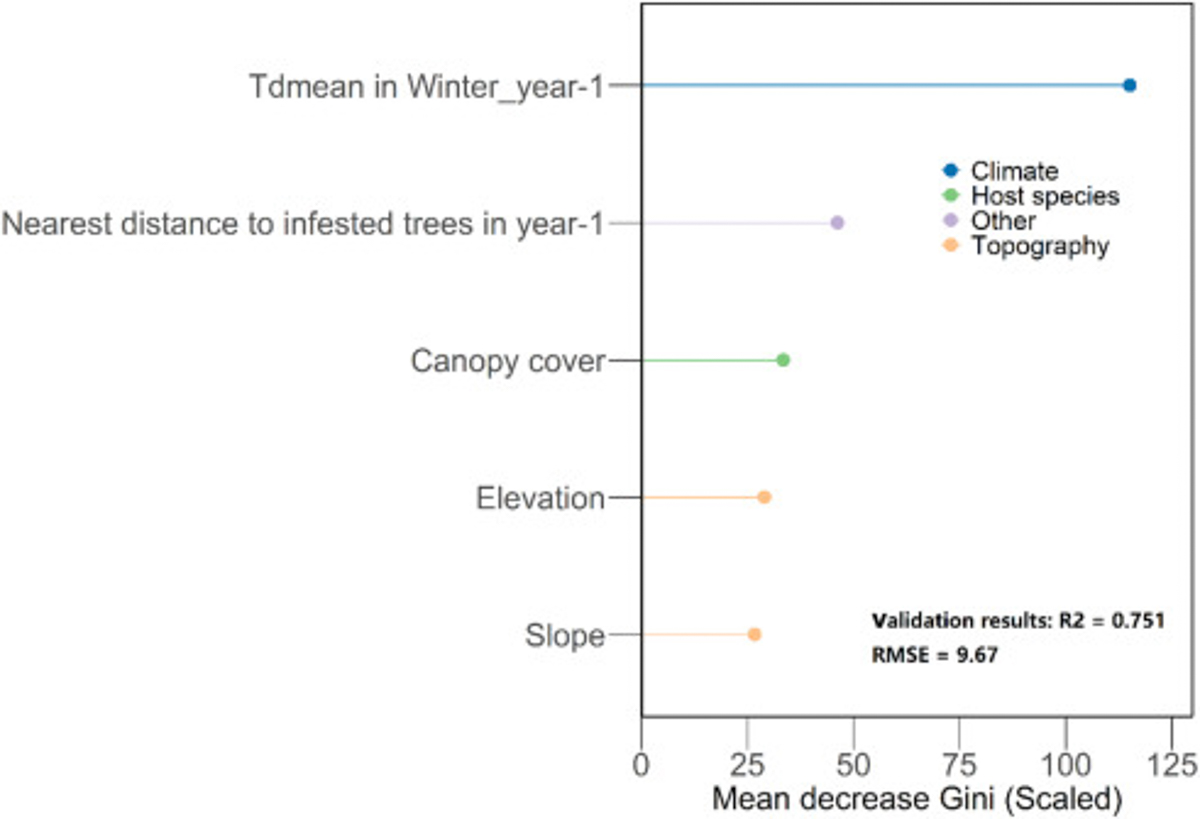
最终,利用人工智能算法,成功解析了驱动虫害爆发蔓延的关键气象和环境因子,建立了虫害烈度预测模型,可在森林景观尺度,提前数月预警病虫害爆发蔓延趋势 (图4)。该研究成果为进一步研究病虫害爆发引起的森林生态结构和功能变化及对全球碳循环的影响奠定了坚实基础,对指导潜在病虫害爆发风险区、适时采取防控措施,实现更有效的森林有害生物管理具有重要的理论和实践价值。研究成果以“Landsat-based monitoring of southern pine beetle infestation severity and severity change in a temperate mixed forest”为题发表,孟冉老师为该论文唯一第一作者和通讯作者。

图4. 影响虫害爆发的关键气象和环境因子重要性排名及预测建模精度。
这些研究得到中央高校基本科研经费项目、华中农业大学研究创业基金项目、国家自然科学基金项目和遥感重点实验室开放基金项目的共同资助。论文合作者来自华中师范大学、美国马里兰大学以及蚂蚁集团。
审核人:孟冉
英文摘要及原文链接:
1.Compared with disturbance maps produced at annual or multi-year time steps, monthly mapping of forest harvesting can provide more temporal details needed for studying the socio-economic drivers (e.g., differentiating salvage logging and slash-and-burn from other timber harvesting) of harvesting and characterizing the associated intra-annual carbon and hydrological dynamics. Frequent cloud cover limits the application of optical remote sensing in timely mapping of forest changes. The freely available Sentinel-1 synthetic aperture radar (SAR) sensor provides an unprecedented opportunity to achieve more frequent mapping of forest harvesting than ever before (i.e., at monthly interval). The unique landscape pattern of forest harvesting from Sentienl-1 data (i.e., how a harvested patch contrasts to surrounding intact forests) holds critical information for harvesting mapping but have not been fully explored. In this study, we propose a deep learning-based (i.e., U-Net) approach using the landscape pattern from Sentinel-1 data to produce monthly maps of forest harvesting in two deforestation hotspots - California, USA and Rondônia, Brazil – for as long as three years. Our results show that (1) our proposed approach is reliable (mean F1 scores (the geometric mean of user's and producer's accuracies) 0.74–0.78; mean IoU (the area of intersection over union between the prediction part and target part) 0.59–0.65) for monthly forest harvesting mapping with Sentinel-1 data, outperforming the traditional object-based approach (0.38–0.43 in IoU). The varying harvesting pattern from Sentinel-1 data can be recognized by the U-Net bottleneck block as whole entities, which is the key advantage of our proposed approach; (2) multi-temporal SAR filtering is helpful for improving the accuracies of our proposed approach (increased F1 and IoU for 0.04 and 0.06, respectively); (3) our proposed model can be trained using samples collected during a particular time period over one location and be fine-tuned using sparse local samples from a new area to achieve optimal performance, and hence can greatly reduce training data collection effort when applied to new study sites; (4) forest harvesting maps produced using our approach revealed substantial variations in monthly harvesting activities: in Rondônia, most of the forest harvest occurred in July/August (the dry season) and about 14% of the dry season harvesting were followed by fires (i.e., slash-and-burn); in California, the rates of forest harvesting were relatively stable, but abnormally high values could occur due to salvage logging after big fires. Our novel approach for mapping forest harvesting at monthly interval represents an important step towards timely monitoring of forest harvesting and assisting stakeholders in developing sustainable strategy of forest management, especially for regions with frequent cloud cover.
链接:https://doi.org/10.1016/j.rse.2021.112822
2.The recent northward expansion of Southern Pine Beetle (SPB) outbreaks associated with warming winters has caused extensive tree mortality in temperate pine forests, significantly affecting forest dynamics, structure, and functioning. Spatially-explicit early warning and detection of SPB-induced tree mortality is critical for timely and sustainable forest management practices. The unique contributions of remote sensing technologies to mapping the location, extent, and severity of beetle outbreaks, as well as assisting in analyzing the potential drivers for outbreak predictions, have been well recognized. However, little is known about the performance of moderate resolution satellite multispectral imagery for early warning and detection of SPB-induced tree mortality. Thus, we conducted this study, as the first attempt, to capture the spatial-temporal patterns of SPB infestation severity at the regional scale and to understand the underlying environmental drivers in a spatially-explicit manner. First, we explored the spectral signatures of SPB-killed trees based on 30-m plot measurements and Landsat-8 imagery. Then, to improve detection accuracy for areas with low-moderate SPB infestation severity, we added spectral-temporal anomaly information in the form of a linear trend of the spectral index trajectory to a previously developed approach. The best overall accuracy increased from 84.7% to 90.1% and the best Macro F1 value increased from 0.832 to 0.900. Next, we compared the performances of spectral indices in mapping SPB infestation severity (i.e., % red stage within the 30-m grid cell). The results showed that the combination of Normalized Difference Moisture Index and Tasseled Cap Greenness had the best performance for mapping SPB infestation severity (2016: R2 = 0.754; RSME = 15.7; 2017: R2 = 0.787; RSME = 12.4). Finally, we found that climatic and landscape variables can explain the detected patterns of SPB infestation from 2014 to 2017 in our study area (R2 = 0.751; RSME = 9.67), providing valuable insights on possible predictors for early warning of SPB infestation. Specifically, in our study area, winter dew point temperature was found to be one of the most important predictors, followed by SPB infestation locations in the previous year, canopy cover of host species, elevation, and slope. In the context of continued global warming, our study not only provides a novel framework for efficient, spatially-explicit, and quantitative measurements of forest damage induced by SPB infestation over large scales, but also uncovers opportunities to predict future SPB outbreaks and take precautions against it.
链接:https://doi.org/10.1016/j.rse.2021.112847
